
SurveilStar, a popular employee monitoring software solution, will generate comprehensive statistics on employees' use of applications, web browsing, and network traffic for the administrator to assess employee performance.
SurveilStar is an Employee Monitoring Software tool that can collect and store the statistics of computer operation and user activities. The software has client-server architecture and allows the administrator to install invisible clients on the computers being monitored. SurveilStar provides comprehensive statistics for every computer, including:
You can view all the basic information of a monitored computer, including user name, PC name, group, IP address, running status, agent version, OS, boot time, last online time, last active time, MAC address and last logon user.
SurveilStar provides statistics for websites, applications and traffic. Each allows you to use pie chart or bar chart. And the chart will list top 10, top 20 or custom numbers according to your need.
You can easily create multiple console accounts for different roles in the company, flexibly assign different management priviledges and control all account passwords, or assign priviledges by computer groups or user groups.
When a computer is disconnected from internet and you don't want to monitor it any more, you can ask console administrator to clear the agent on the offline computer with code.
Application Statistics aims to calculate and analyse computer performance and application usages, providing a powerful statistical function and reliable basis for the administrators to assess employees' work behaviour and performance.
Login SurveilStar Console, select the target computer or group, click menu "Statistics > Application" or "Audit > Application", you can review the application usage in a certain period of time.
![]() Click this button to view application statistics by class, name, detail or group.
Click this button to view application statistics by class, name, detail or group.
![]() Click this button to view sub-category, if any.
Click this button to view sub-category, if any.
![]() Click this button to show All, Top 10, Top 20 or custom number of records.
Click this button to show All, Top 10, Top 20 or custom number of records.
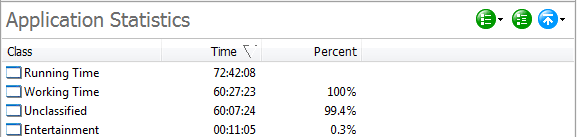
In the Application Statistics, the Running Time and Working Time are the default statistic items. Running Time is the client machine's running time after boot up; Working Time is the client machine's operating time of the keyboard and mouse.
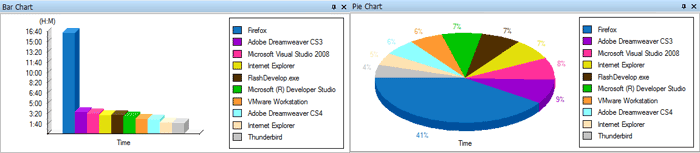
In addition to generating statistical application usage reports, the console will also generate statistical bar chart and pie chart:
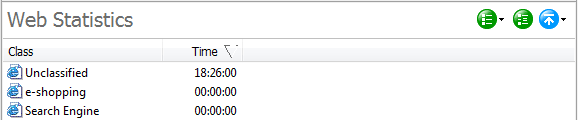
Most employees will browse non-work related websites during the working time. With SurveilStar's comprehensive web statistics, administrator will be able to check the users' web browsing history, and thereby identify problems and take timely countermeasures.
Login SurveilStar Console, select the target computer or group, click menu "Statistics > Web" or "Audit > Web", you can review the web browsing histories over a certain span of time.
![]() Click this button to view web statistics by class, detail or group.
Click this button to view web statistics by class, detail or group.
![]() Click this button to view sub-category, if any.
Click this button to view sub-category, if any.
![]() Click this button to show All, Top 10, Top 20 or custom number of records.
Click this button to show All, Top 10, Top 20 or custom number of records.
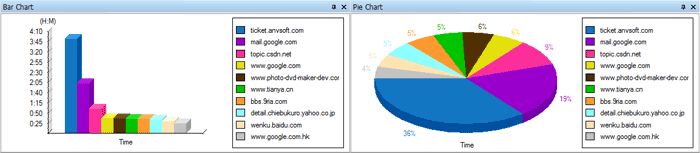
In addition to generating statistical web browsing reports, the console will also generate statistical bar chart and pie chart:
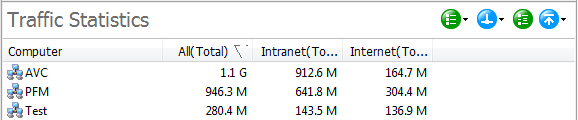
By querying the network traffic, administrators can quickly locate network congestion and other problems, and thereby make corresponding responses. Traffic Statistics includes network address of both sides of communications, ports, bandwidth, and other details. Such information provides administrators with an overview of the current network status and helps administrators to troubleshoot problems.
Login SurveilStar Console, select the target computer or group, click menu "Statistics > Traffic" or "Audit > Traffic", you can review the network traffic statistics over a certain span of time.
![]() Click this button to view traffic statistics by IP, Port, IP Classes, Port Classes, Computer/IP Classes, or Computer/ Port Classes.
Click this button to view traffic statistics by IP, Port, IP Classes, Port Classes, Computer/IP Classes, or Computer/ Port Classes.
![]() Click this button to select traffic direction: Total, Sent, or Received.
Click this button to select traffic direction: Total, Sent, or Received.
![]() Click this button to view sub-category, if any.
Click this button to view sub-category, if any.
![]() Click this button to show All, Top 10, Top 20 or custom number of records.
Click this button to show All, Top 10, Top 20 or custom number of records.
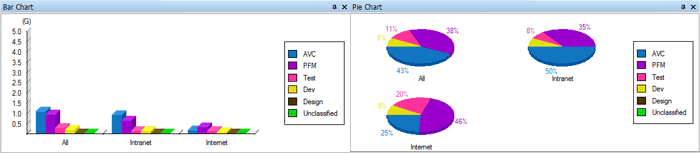
In addition to generating statistical traffic reports, the console will also generate statistical bar chart and pie chart:
![]() Note: Traffic Statistics is calculated based on computers, not the computer users.
Note: Traffic Statistics is calculated based on computers, not the computer users.